Think about the last time you returned a product: the packaging, the shipping label, the wait for a refund. That entire process is reverse logistics – the often-overlooked journey a product takes after it leaves the customer’s hands. While getting products to customers is obviously vital, understanding reverse logistics is crucial.
It can save businesses serious money, reduce waste, and even boost customer satisfaction. In this guide, we’ll dive into the ins and outs of reverse logistics, exploring its benefits and the best strategies to create a system that works for your business.

The Reverse Logistics Process
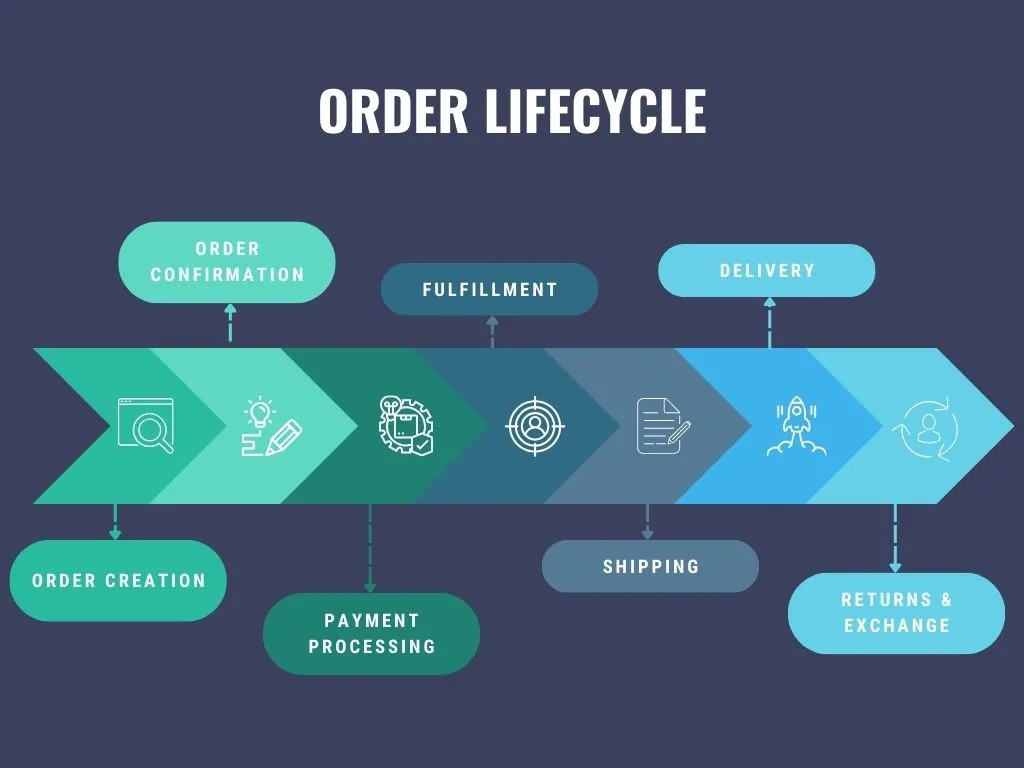
The reverse journey of a product isn’t a straight line. Let’s break down the key stages and the decisions businesses face along the way:
Step 1: Returns Initiation
This is where the customer decides to return something. The ease of this process (clear return policies, prepaid shipping labels) can significantly impact customer satisfaction.
Step 2: Transportation
Getting the product back to a warehouse or processing center involves shipping logistics. Companies might use their own fleets, partner with carriers, or offer convenient drop-off locations. Costs and speed are major factors here.
Step 3: Sorting and Inspection
Once the product arrives, it needs to be assessed. Is it in good enough condition to resell? Does it need repairs or refurbishment? Or is it destined for recycling or disposal?
Step 4: Disposition
This is where the product’s fate is decided. Options include:
- Resale: If it’s in good condition it goes back into inventory.
- Refurbishment: Fixing minor issues to make it like new.
- Recycling: Extracting valuable materials if the product is unusable.
- Disposal: Done responsibly if none of the above are possible.

Benefits of Effective Reverse Logistics
A well-designed reverse logistics system isn’t just about handling problems – it’s a smart business strategy with far-reaching benefits:
- Cost Reduction
- Recaptured Value: Products that can be resold or refurbished represent potential revenue rather than a total loss.
- Optimized Inventory: Good returns data helps avoid overstocking items with high return rates, reducing tied-up capital.
- Efficient Disposal: When disposal is necessary, finding the most cost-effective and responsible method minimizes expenses.
- Enhanced Customer Experience
- Easy Returns Build Trust: Customers are more likely to buy when they know returns are hassle-free.
- Repairs Done Right: Efficiently resolving product issues strengthens customer relationships.
- Loyal Customers: A positive reverse logistics experience adds up to increased customer loyalty and repeat business.
- Environmental Sustainability
- Reduced Waste: Keeping products out of landfills through reselling, refurbishment, and recycling is a win for the planet.
- Compliance: Proper handling of hazardous materials or e-waste demonstrates environmental responsibility and avoids costly fines.
- Resource Conservation: Reusing components and materials lessens the need to extract new resources.
- Improved Brand Reputation
- Customer Values: Consumers increasingly prefer businesses with sustainable practices.
- Positive Image: Highlighting your commitment to responsible reverse logistics builds a trustworthy brand.
- Attracting Partners: Suppliers and investors might be more willing to work with companies demonstrating environmental consciousness.
The benefits of reverse logistics go beyond immediate cost savings. It’s an investment in customer satisfaction, environmental impact, and your company’s overall reputation.
Challenges in Reverse Logistics
While effective reverse logistics offers many benefits, it’s definitely not without its obstacles. Here are some key challenges businesses often face:
- Unpredictable Costs: Return volumes can fluctuate, making it harder to budget accurately for transportation, processing, and disposal.
- System Complexity: Tracking returned products, managing different disposition options, and coordinating with various departments or partners can get complex quickly.
- Reverse Logistics Technology: Finding the right software solutions can be a challenge. Systems need to handle returns, inventory, data analytics, and sometimes even integrations with suppliers or repair partners.
- Customer Fraud: Unfortunately, some customers try to abuse generous return policies, such as returning used items or claiming defects that don’t exist.
- Environmental Regulations: Proper disposal of certain products (electronics, batteries, etc.) requires following strict regulations, which can add cost and complexity.
Don’t Despair!
These challenges are very real, but that’s why dedicating effort to improving your reverse logistics is crucial. Later in this guide, we’ll explore strategies and technologies to address these challenges, turning them into opportunities for streamlining your operations.

Technologies Driving Reverse Logistics
The right technology can transform reverse logistics from a headache into a competitive advantage. Here are some key players:
Core Technologies
- Barcodes and RFID: These underpin effective tracking. A simple scan or RFID tag can tell you instantly where a product is within the reverse process and what its history is (previous repairs, etc.).
- Warehouse Management Systems (WMS): These systems become even more vital when handling not just outgoing shipments, but incoming returns with different destinations within the warehouse.
- Returns Management Software: Specialized platforms handle the customer-facing side of returns, generating labels, tracking progress, and initiating refunds, keeping the process smooth.
Data-Driven Optimization
- Analytics and Reporting: Turning returns data into actionable insights is key. The right software helps identify high-return products, spot patterns in return reasons, and optimize processes.
- Inventory Forecasting: Returns data can improve demand forecasting models, preventing overstocking and the excess inventory that might later need complicated disposal.
Emerging Trends
- Artificial Intelligence (AI): AI is being used to predict return likelihood, automate parts of the inspection process, and even personalize the returns experience for customers.
- Blockchain: Primarily for secure and transparent tracking, especially important when multiple partners are involved in the reverse supply chain or dealing with high-value goods.
The best tech setup depends on your company’s specific needs. A small business might need a simple returns platform, while a large retailer requires a complex system integrating with their existing inventory management.
Reverse Logistics: The Hidden Key to Business Success
Reverse logistics might not be the most glamorous part of business, but it’s undeniably important. By streamlining your returns, repairs, and disposal processes, you save money, boost customer satisfaction, and even act as a responsible corporate citizen. Investing in reverse logistics isn’t just a smart move today, it’s future-proofing your business for a world where efficiency and sustainability matter more than ever.
Frequently Asked Questions About Returns and Reverse Logistics
What’s the difference between reverse logistics and regular supply chain management?
While they share some similarities, reverse logistics is its own beast! Think of your regular supply chain as a one-way street – sourcing materials, making products, getting them to customers. Reverse logistics is the winding road those products might take back – returns, repairs, and responsible end-of-life handling. It requires different processes, technology, and often a separate mindset.
Our return rate is low, do we really need to invest in reverse logistics?
Even a low return rate hides valuable insights. Analyzing why products get returned, even in small numbers, can prevent manufacturing defects, improve product descriptions, and stop customer frustration before it starts. Additionally, efficient reverse logistics ensures that when returns DO happen, they don’t become a money drain.
Can reverse logistics help small businesses compete with big retailers?
Absolutely! Easy returns and repairs build trust, which is especially important for smaller brands who are building a reputation. Smart small businesses can often be more nimble than big corporations in optimizing their reverse logistics, using it as a way to stand out with excellent customer service.
How do I balance generous return policies with preventing fraud?
This is a valid concern! The key is in data and some smart policy making. Analyzing return patterns helps spot abusers (like serial returners). Technologies exist to flag unusual behavior. Also, have clear policies that are easy for customers to find, strike a reasonable balance, and train your staff to spot red flags.
Is it worth outsourcing parts of reverse logistics?
It depends! Companies specialize in different things – repairs, transportation, even just handling the customer-side returns process. If you lack in-house expertise, your time might be better spent on what you do best, outsourcing elements to specialists. However, consider the costs carefully and ensure it aligns with your overall strategy.


